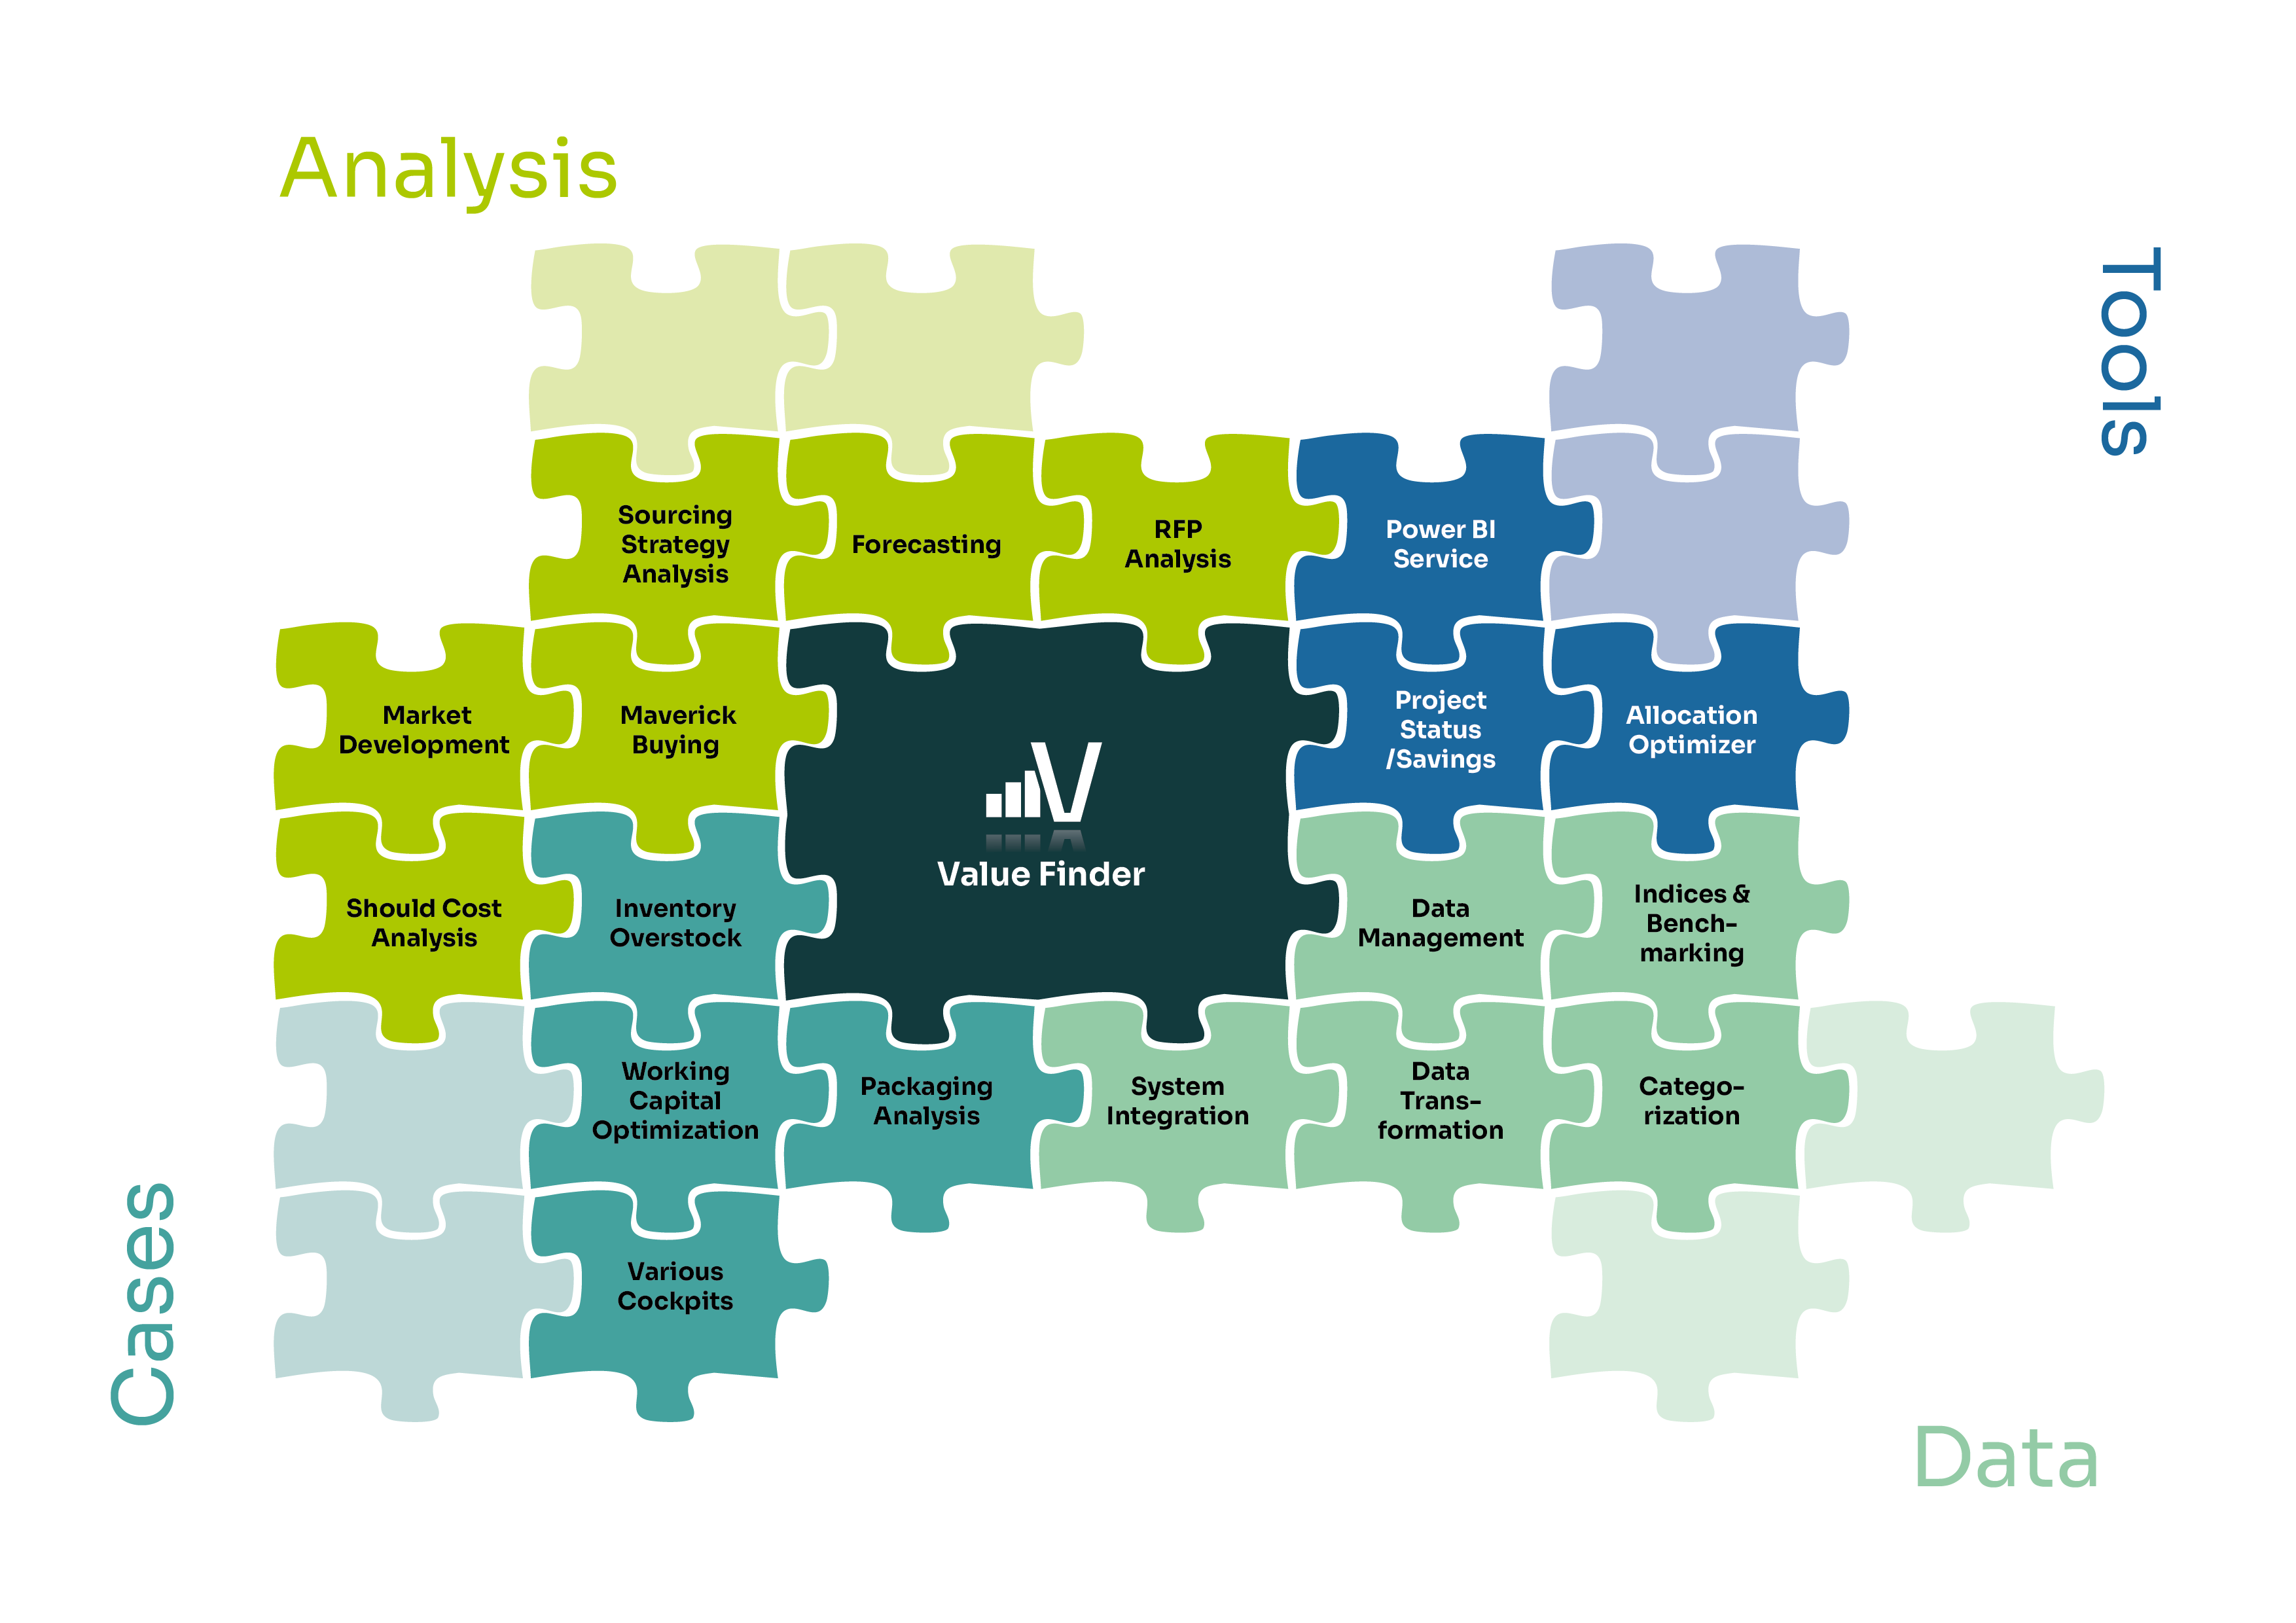
- Gain transparency on consolidated spend data and rely on a single source of truth
- Build on INVERTO’s years of experience in supply chain and procurement, incorporating our analysis best practices
- Compare prices, delivery conditions and transaction costs across all international entities
- Track, compare and forecast price developments over years
- Integrate external data sources, e.g. monitor the seasonal price development of listed commodities
- Measure KPIs and savings, trends, and performance on a regular basis
Gaining transparency – create a single source of truth and unlock valuable insights.
The INVERTO Value Finder
This tool enhances our capability to take data analytics to the next level. From working capital optimizations, freight analysis to spend analytics, these are just a few of the typical applications of our tool. It is structured in modules, capable of being enhanced to meet your specific project needs and pain points. With an excellent team of more than 300 tech-enabled consultants and a dedicated Data & Insights team we provide visualized answers, taking into account millions of different data points.
Our pre-designed templates for standard analysis provide insights within a few days, enabling data to be analyzed from multiple perspectives: category, supplier, product categories or by tracking your most relevant KPI’s or those which we find important, based on more than 10 years of experience.
Due to our dedicated Data & Insights team and more than 80 projects leveraging data analytics, we provide best practices and solutions for typical pain points in your industry or sector.
Functionality of the INVERTO Value Finder
The Value Finder is a Microsoft based solution and therefore uses the leading technology when it comes to analytics and business intelligence.
It functions as a framework tool that can be integrated into your existing system landscape and enhanced by analyses tailored to your specific project needs. With over 50 different modules and best practices for every major industry or corporate function, we are well-equipped to solve the challenges you are facing. The latest project applications include an automatic setting for reorder points, retail dashboard and working capital optimization among many others.
How do we set up the Value Finder in your company?
This happens in close alignment with your relevant functional departments, as well as controlling, IT, or ERP, leveraging our best practices from past project experiences. By implementing those analyses, we not only provide value through a onetime view on data but strive to create sustainable solutions for the client. Whenever desired and within our scope, we can implement the set-up of analyses within our clients’ IT environment. This enables the client to continually use the dashboards, providing a fast intermediate alternative to a full-fledged software implementation.
We identify relevant data sources and establish seamless integration with our clients’ data, be it file extraction or ERP/database connections. To enhance the data model, we incorporate external data like benchmarks and indices, enhancing the depth and accuracy of our insights.
We create dedicated data pipelines, applying robust transformation techniques to cleanse, standardize, and remove inconsistencies or errors. Through filters, we refine the dataset, including relevant information for focused analyses. We also harmonize supplier names and categorize spending, enhancing clarity and enabling meaningful comparisons. With our data transformation expertise, we provide accurate and structured data to set the foundation for informed decision-making.
We develop a comprehensive model with fact and dimensional tables, linking quantitative information and additional qualitative characteristics such as a supplier -, category -, or material table. Our refined architecture ensures optimal performance and scalability. By establishing relationships between data tables, we create a cohesive structure for seamless navigation and efficient data retrieval. Our expertise in data modeling provides your company with a robust framework for accurate and insightful analyses. This data model is designed with simplicity and scalability in mind, ensuring easy expansion to accommodate additional data in the future. Moreover, the primary emphasis of our provided data model is on usability, catering to clients of all sizes and handling varying volumes of data without any compromise.
We identify and calculate relevant KPIs, creating visually compelling and intuitive data representations using advanced visualization tools. Our customized dashboards and deep dives facilitate effective decision-making. While focusing on a good UI/UX design, we prioritize usability and accessibility for seamless and engaging user experiences. We offer a smooth handover of dashboards, enabling online sharing and collaboration. Our data visualization services empower your company with data-driven insights and informed decision-making.